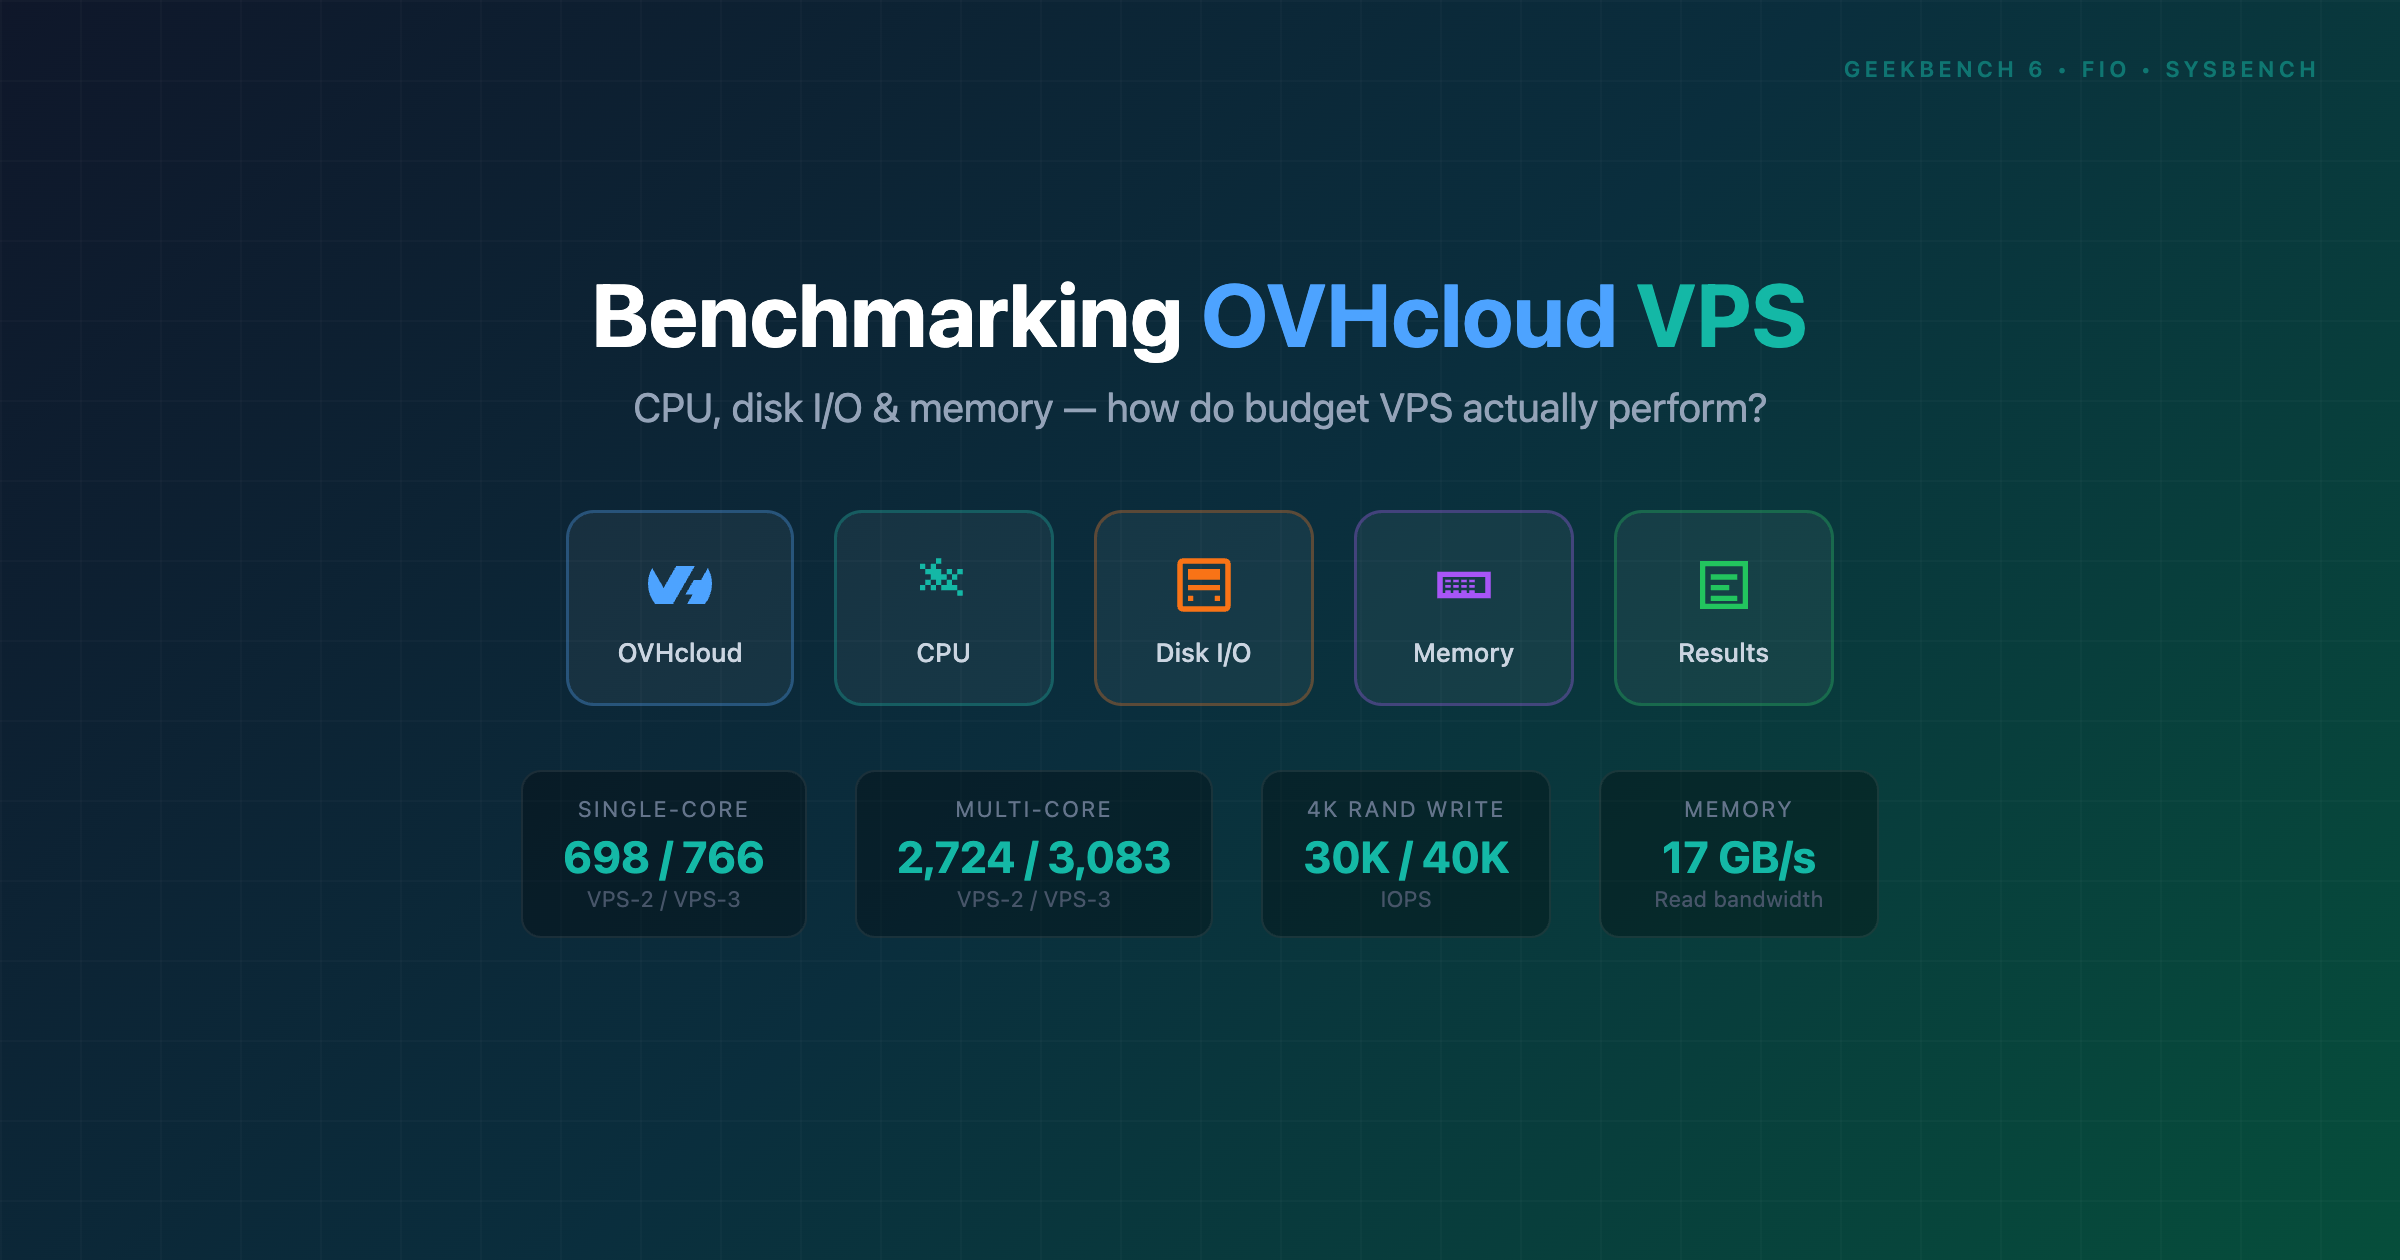
OVHcloud VPS Benchmark 2026: Geekbench 6, Disk I/O & Memory Performance
I’ve got two OVHcloud VPS instances – a VPS-2 and a VPS-3 from the 2026 range – running Debian 12 on KVM/OpenStack. Figured it was time to actually benchmark them with Geekbench 6, fio, iperf3, and sysbench to see what you really get for €8.49/month and €16.99/month. Both report as Intel Haswell CPUs, but the “same” hardware can perform very differently depending on noisy neighbors and background workloads 😅
OVHcloud VPS Plans & Pricing
OVHcloud’s 2026 VPS range starts at €5.52/month and scales up to 24 vCores. I’m testing the VPS-2 (€8.49/month) and VPS-3 (€16.99/month):
Hardware Specs
| VPS-2 (€8.49/mo) | VPS-3 (€16.99/mo) | |
|---|---|---|
| CPU | Intel Haswell (no TSX), 6 vCPU @ 2.39 GHz | Intel Haswell (no TSX), 8 vCPU @ 2.40 GHz |
| RAM | 11.4 GB | 22.9 GB |
| Storage | 100 GB NVMe (QEMU virtio) | 200 GB NVMe (QEMU HARDDISK) |
| Bandwidth | 1 Gbps | 1.5 Gbps |
| Location | Gravelines, France (GRA) | Frankfurt, Germany (DE) |
| OS | Debian 12 (bookworm) | Debian 12 (bookworm) |
| Kernel | 6.1.0-44-cloud-amd64 | 6.1.0-39-cloud-amd64 |
| Hypervisor | KVM (OpenStack Nova) | KVM (OpenStack Nova) |
CPU Benchmark: Geekbench 6 Scores
Grabbed Geekbench 6.4.0 for Linux:
cd /tmp
wget https://cdn.geekbench.com/Geekbench-6.4.0-Linux.tar.gz
tar xzf Geekbench-6.4.0-Linux.tar.gz
cd Geekbench-6.4.0-Linux
./geekbench6
| VPS-2 (6 vCPU) | VPS-3 (8 vCPU) | |
|---|---|---|
| Single-Core | 698 | 766 |
| Multi-Core | 2,724 | 3,083 |
The OVHcloud VPS-3 is ~10% faster single-core than the VPS-2 despite nearly identical Haswell hardware. The 13% multi-core gap is mostly the extra 2 cores (8 vs 6). The remaining difference? Probably noisy neighbors on the host node.
Disk I/O Benchmark: fio
Used fio for storage benchmarks. Tested sequential and random I/O with direct I/O (bypassing page cache):
apt-get install -y fio

# Sequential read/write (1M block size)
fio --name=seq-read --ioengine=libaio --direct=1 --bs=1M --size=1G --numjobs=1 --rw=read
fio --name=seq-write --ioengine=libaio --direct=1 --bs=1M --size=1G --numjobs=1 --rw=write

# Random 4K read/write (4 jobs, queue depth 32)
fio --name=rand-read --ioengine=libaio --direct=1 --bs=4k --size=256M --numjobs=4 --iodepth=32 --rw=randread
fio --name=rand-write --ioengine=libaio --direct=1 --bs=4k --size=256M --numjobs=4 --iodepth=32 --rw=randwrite
Sequential Throughput
| Test | VPS-2 | VPS-3 |
|---|---|---|
| Sequential Read | 1,362 MiB/s | 1,278 MiB/s |
| Sequential Write | 722 MiB/s | 689 MiB/s |
Random 4K IOPS
| Test | VPS-2 | VPS-3 |
|---|---|---|
| Random Read | 30,300 IOPS | 40,600 IOPS |
| Random Write | 30,300 IOPS | 40,600 IOPS |
The OVHcloud VPS-2 edges out on sequential I/O, but the VPS-3 smokes it on random 4K with ~34% more IOPS. Random I/O matters more for real workloads like databases and container storage.
Storage Latency
Raw latency tested with a single job at queue depth 1:
| Test | VPS-2 Latency | VPS-2 IOPS | VPS-3 Latency | VPS-3 IOPS |
|---|---|---|---|---|
| Random Read 4K | 171 µs | 5,769 | 152 µs | 6,514 |
| Random Write 4K | 149 µs | 6,630 | 117 µs | 8,445 |
Both sub-200µs, confirming NVMe-backed storage on both OVHcloud VPS plans. The VPS-3 edges ahead on write latency (117µs vs 149µs on the VPS-2). Solid numbers for budget virtual private servers.
Memory Bandwidth: sysbench
apt-get install -y sysbench

# 1M block size, 10GB total
sysbench memory --memory-block-size=1M --memory-total-size=10G --memory-oper=read run
sysbench memory --memory-block-size=1M --memory-total-size=10G --memory-oper=write run
| Test | VPS-2 | VPS-3 |
|---|---|---|
| Memory Read | 16,752 MiB/s | 17,342 MiB/s |
| Memory Write | 12,705 MiB/s | 13,839 MiB/s |
Very close across both. VPS-3 has a slight edge on writes (~9%) but overall they’re within noise of each other. Both reasonable for virtualized Haswell.
Network Benchmark: iperf3
Tested against proof.ovh.net (OVH’s own test endpoint in Gravelines) using 4 parallel streams:
apt-get install -y iperf3

# Upload (4 parallel streams)
iperf3 -c proof.ovh.net -p 5201 -t 10 -P 4

# Download (reverse mode)
iperf3 -c proof.ovh.net -p 5201 -t 10 -P 4 -R
| Test | VPS-2 (Gravelines, 1 Gbps) |
|---|---|
| Upload | 975 Mbits/sec |
| Download | 943 Mbits/sec |
VPS-2 saturates its 1 Gbps pipe in both directions. Note that proof.ovh.net is also in Gravelines, so this is an intra-datacenter test. VPS-3 results (Frankfurt, 1.5 Gbps) coming soon.
Bonus: Mac Mini M4 Pro Comparison
For context, I ran the same benchmarks on my Mac Mini M4 Pro (14-core, 64 GB RAM, 2 TB SSD) sitting at home on a 2.5 Gbps fiber connection. This isn’t really a fair fight, but it puts the VPS numbers in perspective for anyone debating cloud vs self-hosted.
Full Comparison
| Benchmark | VPS-2 (€8.49/mo) | VPS-3 (€16.99/mo) | Mac Mini M4 Pro |
|---|---|---|---|
| Geekbench 6 SC | 698 | 766 | 3,707 (5.3x) |
| Geekbench 6 MC | 2,724 | 3,083 | 22,953 (8.4x) |
| Seq Read | 1,362 MiB/s | 1,278 MiB/s | 14,900 MiB/s (11x) |
| Seq Write | 722 MiB/s | 689 MiB/s | 6,606 MiB/s (9x) |
| 4K Rand Read | 30,300 IOPS | 40,600 IOPS | 794,000 IOPS (20x) |
| 4K Rand Write | 30,300 IOPS | 40,600 IOPS | 50,400 IOPS |
| Read Latency | 171 µs | 152 µs | 4.3 µs (40x) |
| Write Latency | 149 µs | 117 µs | 114 µs |
| Mem Read | 16,752 MiB/s | 17,342 MiB/s | 28,188 MiB/s (1.7x) |
| Mem Write | 12,705 MiB/s | 13,839 MiB/s | 31,709 MiB/s (2.5x) |
| Network Up | 975 Mbps | TBD | 1,750 Mbps |
| Network Down | 943 Mbps | TBD | 1,590 Mbps |
Geekbench results: Mac Mini M4 Pro
The M4 Pro is in a completely different league on CPU (5x single-core, 8x multi-core) and random read IOPS (20x). Write latency is surprisingly close though, with APFS journaling bringing the M4 Pro back down to earth. The Mac Mini’s network was tested over WAN to proof.ovh.net in France on a 2.5 Gbps residential fiber connection, so the 1.75 Gbps is limited by routing and distance, not the local pipe.
Of course, VPS has its own advantages: always-on, public IP, no electricity bill, geographically distributed, and €8-17/month is hard to argue with for running Docker workloads 24/7.
TL;DR
- CPU: Geekbench 6 scores of 698-766 single-core, 2,724-3,083 multi-core on VPS. M4 Pro scores 3,707 / 22,953 (5-8x faster)
- Disk: VPS gets NVMe-backed storage with sub-200µs latency and 30-40K random IOPS. M4 Pro’s SSD does 794K read IOPS with 4µs latency
- Memory: ~17 GB/s on VPS vs ~28 GB/s on M4 Pro
- Network: VPS-2 saturates its 1 Gbps pipe. Mac Mini pushes 1.75 Gbps over WAN on 2.5 Gbps fiber
- Value: For always-on workloads with a public IP, €8.49/month is hard to beat. For raw compute, nothing touches Apple silicon at this price point
This post was written with the help of Claude (Opus 4), Anthropic’s AI assistant.